5.3 Other Methods
Prices
Proposed
National Transfer Accounts are estimated using nominal values of income and expenditure aggregates. Values are converted to real values using the GDP deflator (chain-linked index, if available).
Note: This recommendation is based on a lecture by Kosuke Suzuke? at the NUPRI 2005 workshop.
Smoothing
Lowess Method
Smoothing is done using the lowess command in Stata, on individual level estimates for key variables. The syntax in smoothing labor income estimates for Taiwan:
lowess yl age, bwidth(0.1) gen(syvar) nograph
Where yl is the key variable to be smoothed; bwidth(*) specifies the bandwith and gen(*) is used to save smoothed values. (Graphs are supressed using the nograph option.) Key variables include consumption (health and other, education is not being smoothed at this time), labor income, housing, and taxes. Lowess is used to carry out a locally weighted regression of the key variable on age, making use of the option to save the smoothed variable. Smoothed variables are then used to produce the smoothed age profiles.
The default bandwidth in Stata is 0.8; for Taiwan estimates, a bandwidth of 0.1 was used. The optimal bandwidth is dependent on the variable and dataset, and is determined through examination of smoothed profiles plotted against unsmoothed ones. A larger bandwith increases the smoothing, eliminating more of the variation inherent in the unsmoothed variables. Once smoothed variables are obtained, a plot of the smoothed and unsmoothed age profiles should be done to ensure that smoothing was carried out properly. Age profiles of labor income for Taiwan (1998), using varying bandwidths, are provided below for illustration:
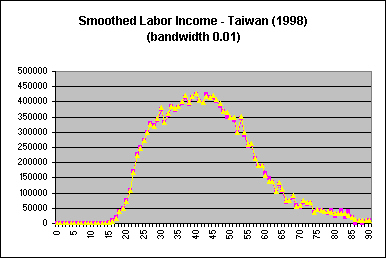
| Too narrow a bandwidth results in smoothed estimates that are still noisy. |
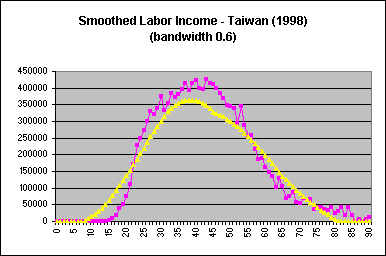
| A bandwidth that is too wide does not provide an accurate representation of the unsmoothed data. |
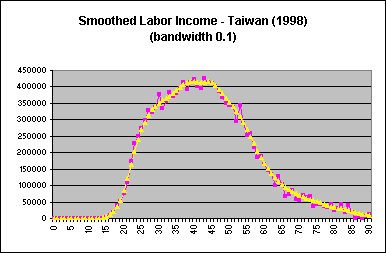
| The proper bandwidth smoothes out extreme values and excess noise, but the general shape of the age profile remains. |
Smoothed estimates of key variables are then used in futher calculations, and no further smoothing is done.
Warnings and Caveats
In some instances Stata will produce smoothed values that consistently larger (or smaller) than unsmoothed values. One explanation, as in the case of Thailand below, is the effect of weighting. The lowess command does not allow the incorporation of weights when smoothing. When the use of weights significantly affects the shape of the age profile the following may occur:
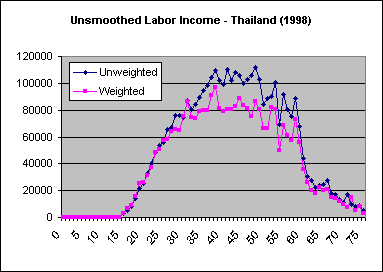
| In the case of Thailand, there are significant differences in the shapes of weighted and unweighted profiles. |
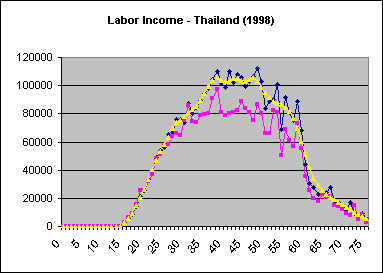
| Smoothing results in estimates that are systematically greater than those of the unsmoothed weighted profile, but are consistent with the unweighted profile. |
One possible solution is pre-weighting data before smoothing is applied. However, as lowess is computationally intensive, smoothing weighted data is extremely time consuming.
Using Lowess with Sample Weights
Friedman's SuperSmoother (work in progress)
Data Clean Up
Underestimate / Overestimate Population Data
Issue
Number of population of certain ages (usually early ages) is underestimated/ overestimated.
Background
In some countries, such as Taiwan, parents do not report their children until the children have name, which may take several years.
Detection
Check the survival rates by single age group. If the values are more than one, there may be some problem.
Remedy
Data Cohort
Converting Cross-Sectional to Cohort Data
For most countries, data is provided for a series of cross-sectional samples. However, it is often desirable to be able to follow the movements of a particular group over time. A simple description of the method used for converting cross-sectional data into cohort data follows.
Cohort data consists of observations in the cross-sectional data which follow cohorts' progression. For data on the cohort born in year t, the cohort's observations of variable x can be expressed as and
is the oldest age.
The following Excel spreadsheet was used in converting consumption and labor income data for Taiwan: Cohort template. An example of converted data can be found on the methods page for Labor Income.
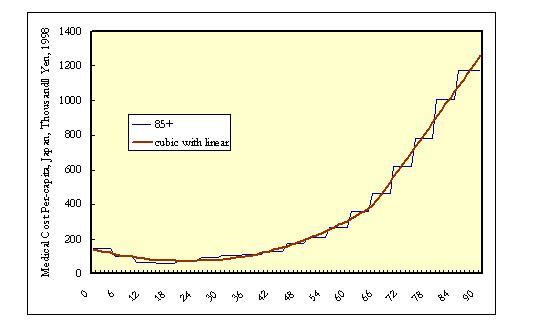
Fitting a curve to age profiles with broad age groupings
Age profiles published in statistical year books are usually for five-year age groups. Sometimes the age interval varies within the series. The mean values for each age group will depend on the age distribution of the population within the age group. The upper, open-ended age group may be particularly influenced by the age distribution, especially if the age interval is large. The attached document describes a method and includes stata files for fitting a curve to grouped data. The example is per capita health expenditure in Japan.
Triangle Graph
Age Pyramid
Age Pyramid Source: Joze Sambt
-- Back to Table of Contents
