1. Overview
The purpose of National Transfer Accounts (NTA) is to measure at the aggregate level how those at each age acquire and use economic resources. The work is motivated in large part by a fundamental feature of all societies – the economic lifecycle, i.e., the mismatch between material needs and the ability to satisfy those needs through labor. The economic lifecycle is quantified in National Transfer Accounts by comparing consumption and labor income. The young and the old have a lifecycle deficit because they produce less through their labor than they consume. Working-age adults have a lifecycle surplus because they produce far more through their labor than they consume (Lee, Lee, and Mason 2008 ; Mason, Lee, Tung, Lai, and Miller 2009).
The economic lifecycle reflects many behavioral and non-behavioral factors that influence the relationship between age, on the one hand, and consumption and labor income, on the other. Average labor income at each age depends on hours worked, labor force participation, the age profile of wages and the many cultural, political, social, and economic factors that influence each of these elements of labor income. In similar fashion, average consumption at each age is influenced by historical events, by preferences, by prices including interest rates, by political systems, and by many other forces.
At the aggregate level the economic lifecycle also reflects the population age structure. In young populations, the aggregate economic lifecycle is dominated by the large lifecycle deficit, the economic resource needs, of the young. Over the course of the demographic transition, populations age and the lifecycle deficit of the old becomes increasingly important.
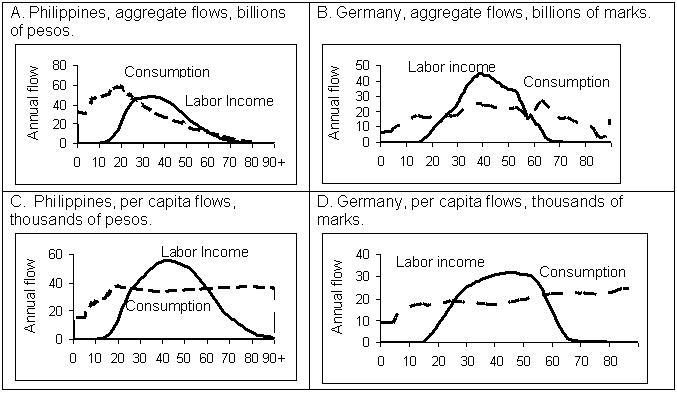
Figure 1 compares the economic lifecycle of two countries at very different stages of the demographic transition. The Philippines has a relatively young age structure while Germany’s is relatively old. The upper panels show the aggregate economic lifecycles for both countries while the lower panels show the per capita values. Those under the age of 27 in the Philippines and in Germany are consuming more than their labor income. Those 60 or older in the Philippines and 58 or older in Germany are also consuming more than their labor income.
The sheer magnitudes of the lifecycle deficits in both countries warrant emphasis. The combined deficit of the young and old is 65% of total labor income in the Philippines and 52% in Germany. The most striking difference between the two countries is that the child deficit is so large relative to the old-age deficit in the Philippines (almost 15 times larger), while in Germany the old-age deficit is 50 percent larger than the child deficit. The difference between the two countries is to a great extent a consequence of population age structure, but there are also important differences between the per capita profiles of consumption and labor income for the two countries.
Figure 1. Economic Lifecycle, the Philippines and Germany.
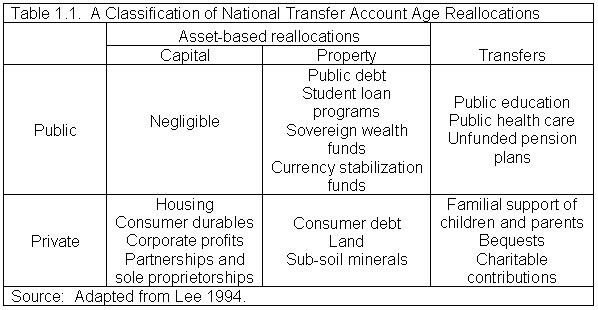
The lifecycle deficits and surplus are sustainable only because a complex system of institutions and economic mechanisms enable flows of economic resources from surplus to deficit ages (Lee 1994a; Lee 1994b). Economic flows across age are mediated by both the public sector and the private sector. The public sector reallocates resources relying on social mandates embodied in law and regulation and implemented by local, regional, and national governments. Education, public pensions, and health care programs are important examples of public reallocation programs, but even public spending on defense or public diplomacy involve age reallocations to the extent that taxes are disproportionately born by some age groups while benefits are shared by all. Private sector reallocations are governed by voluntary contracts, social conventions, and deeply ingrained behavioral patterns that are mediated by markets, households, families, charitable organizations, and other private institutions. Important examples of private reallocations are private saving, credit transactions, and familial support to children and the elderly (Table 1.1).
The economic mechanisms used for age reallocations fall into two broad categories: transfers and asset-based reallocations. A defining feature of transfers is that they involve no explicit quid pro quo or exchange of money for goods or services. Resources flow from one party to another either voluntarily, in the case of most private transfers, or not, in the case of public transfers. The transfers of interest in NTA are inter-age or intergenerational transfer.
Asset-based reallocations realize inter-age flows through inter-temporal exchange. For example, an asset such as gold can be acquired in one period, generating an outflow at that age, and disposed of in a subsequent period generating an inflow at an older age. More generally asset-based reallocations involve two kinds of flows – asset income and saving. When individuals accumulate pension funds or personal savings during their working years and rely on asset income and/or dis-saving of those assets during their retirement years, they are relying on asset-based reallocations. Or when individuals borrow to finance their education, they are relying on asset-based reallocations to shift resources to young ages when they are in need from later in life (older ages).
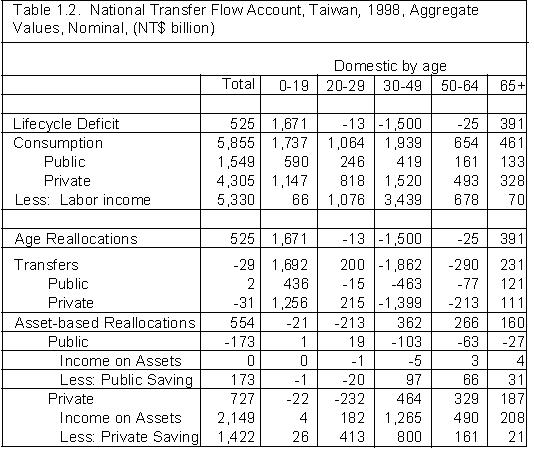
A complete flow account in highly summarized form is provided in Table 1.2. The values in the table are calculated by single year of age but aggregated into broader age groups. Much of the detail about the elements in the flow account is not presented here, but the broad outlines of the economic lifecycle and the age reallocation system are documented. Children under the age of 20 in Taiwan in 1998 depended almost entirely on transfers to meet their lifecycle deficit. Of those transfers over 70 percent were private and under 30 percent public. Transfers provided about 60 percent of the lifecycle deficit for the elderly and asset-based reallocations about 40 percent. Public and private transfers were roughly equal in importance. The elderly relied heavily on asset income, but they did not dis-save. Rather they had very modest saving.
The economic flows, which comprise the National Transfer Flow Account, are part of larger conceptual framework that measures the economic flows and the evolution of wealth experienced by cohorts as they advance from childhood, to adulthood, and eventually to the end of life. A complete set of accounts would consist of four sub-accounts: a balance sheet, a flow account, an asset transfer account, and holding gains. Those familiar with the System of National Accounts will recognize the parallels with NTA. The basic accounting identity linking these elements is:
where "W(x,t)" is the wealth of those of age x at the end of year t , F(x,t) is net flows for those age x during year t,
is capital transfers during the period for each age, and H(x,t) is holding gains during the period for each age. The flows, measured in the NT Flow Account, consist of the good and services produced and distributed during the current period. These are the same flows that are the most familiar and widely used aggregate economic measures, e.g., GDP, consumption, saving and investment, etc. Transfers in the flow account refer to goods and services produced during the current period and transferred to individuals of a different age. Asset transfers refer to large, previously accumulated wealth that is transferred to individuals of a different age. Examples of asset transfers are bequests, dowry, and other large inter vivos gifts. The asset transfer account in NTA is conceptually similar to the capital transfer account in UNSNA, although SNA only measured inter-sectoral flows. Holding gains include two distinct categories of factors that influence wealth. The first is changes in asset prices. The second category is non-market changes, e.g., losses due to war or natural catastrophe.
A draft version of NTA manual can be downloaded here: NTA manual v1 Draft
-- Go to next page 2. Economic Lifecycle
-- Back to Table of Contents