UNPD Project 2016
Support Ratio and Demographic Dividends: Estimates for the World
The world is in the midst of an extraordinary and unprecedented change in population age structure with profound implications for national, regional and global economies. For many developing countries, especially in sub-Saharan Africa, demographic change may be highly favourable producing a demographic dividend. Many other countries are in a post-dividend world where population aging may lead to slower economic growth and strain public budgets. The analysis presented in the study, however, shows that population aging may produce a second demographic dividend with continued improvements in standards of living.
The new study, commissioned by the United Nations Population Division, is available as a Technical Paper of the UN Population Division:
http://www.un.org/en/development/desa/population/publications/technical/index.shtml
The paper is also an official document for the 50th Commission on Population and Development and is available on the Commission’s website:
http://www.un.org/en/development/desa/population/commission/sessions/2017/index.shtml
The study generated four important demographic indicators, available for download, that are essential to analyzing the linkages between demography and the economic.
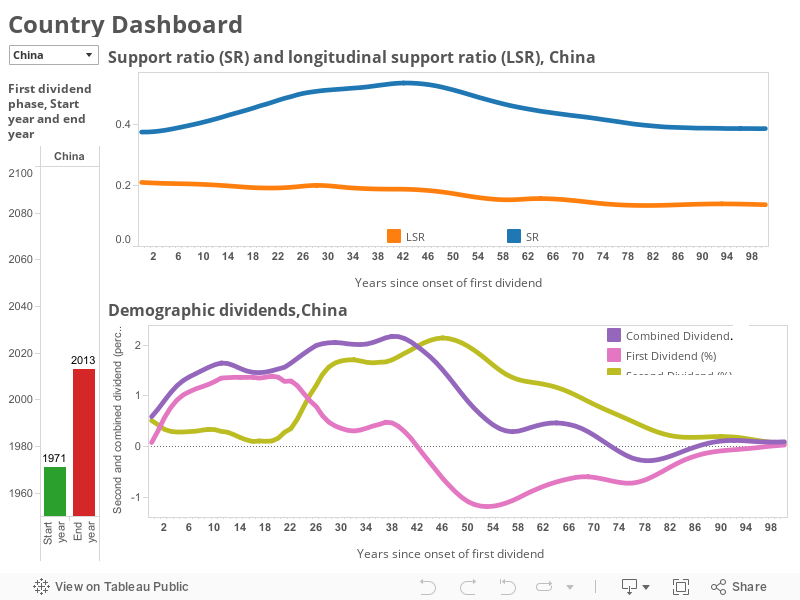
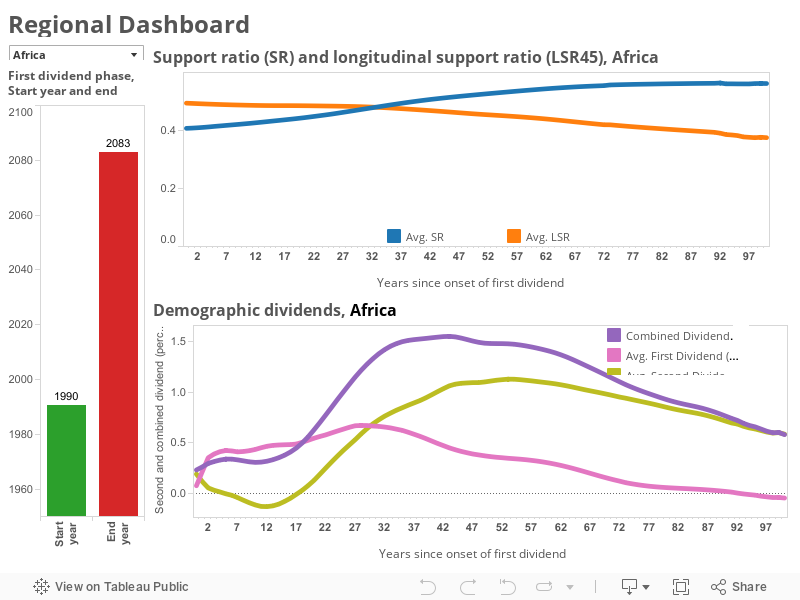
- Support ratio: the number of workers relative to the number of consumers. Number of workers incorporates age-specific variation in labor force participation, unemployment, hours worked, and productivity. Number of consumers incorporates age-specific variation in needs or wants based on age-specific consumption data.
- Longitudinal support ratio: remaining years of labor relative to remaining years of consumption for pre-retirees and retirees (those 45 years of age and older). Years of labor incorporates labor force participation, unemployment, hours worked, and productivity. Years of consumption incorporates age-specific variation in needs or wants based on age-specific consumption data.
- First demographic dividend: effect of population change on economic growth due to changes in the concentration of the population at the working ages. Economic growth is measured as the growth rate of income per effective consumer.
- Second demographic dividend: effect of population change on economic growth due to changes in pension wealth and capital intensity. Economic growth is measured as the growth rate of income per effective consumer.
The indicators are constructed using UN population projections (medium variant projection) and estimates of consumption and labor income by age from National Transfer Accounts (NTA). At the time of the study NTA profiles were available for 60 countries. Age profiles have been estimated for an additional 106 countries making it possible to construct estimates of the support ratio, the longitudinal support ratio, and the first demographic dividend for 166 countries. Because of data availability issues, estimates of the second demographic dividend have been constructed for only 111 countries.
Citation: Andrew Mason, Ronald Lee, Michael Abrigo, and Sang-Hyop Lee (2017) "Support Ratio and Demographic Dividends: Estimates for the World" Technical Paper 2017-1 Population Division, Department of Economic and Social Affairs, United Nations.
Data access
Data access is provided in two forms--as downloads and as dashboards. Demographic indicators, available annually from 1950 to 2100, can be downloaded in Stata or CSV format (compatible with Excel). Labor income and consumption age-profiles can also be downloaded, as Stata or CSV files. Labor income and consumption are normalized by dividing by the average value of labor income and consumption, respectively, of those age 30-49. Labor income and consumption profiles are not available for a few countries that have not yet released their estimates.
- Demographic indicators, 1950-2100, annual: UN Indicators Stata UN Indicators CSV
- Labor income and consumption profiles: Yl and C Stata Yl and C CSV
If available NTA estimates constructed by country teams (country estimates) and values from the age profile model (model estimates) are both provided.
Dashboards are used to display trends in indicators for a country, region, or sub-region selected by the user. Note that the trends in demographic indicators are plotted against years since the start of the first demographic dividend. This approach facilitates comparison of trends in countries at very different points in their demographic transitions.