NTA2020 Vargha
Global Meeting on Population and the Generational Economy, August 2020
Presentation: Lili Vargha, Bernhard Binder-Hammer, New Ways to Visualize NTA age profiles
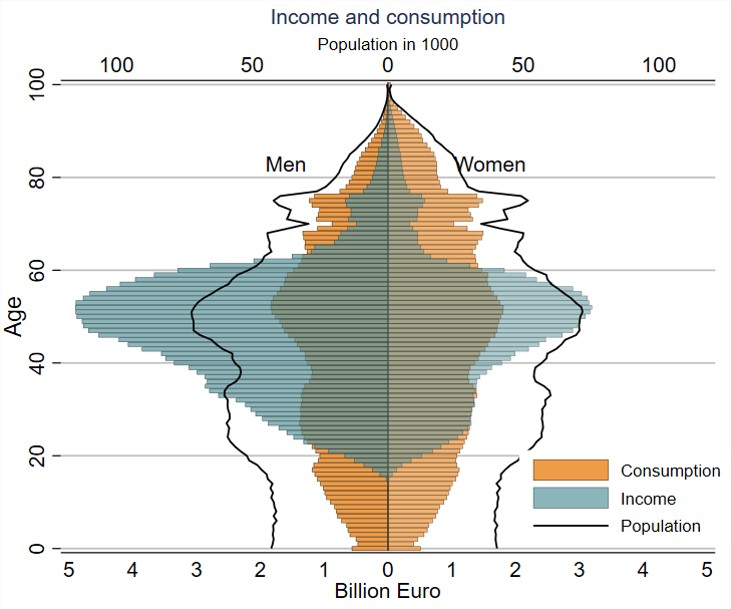
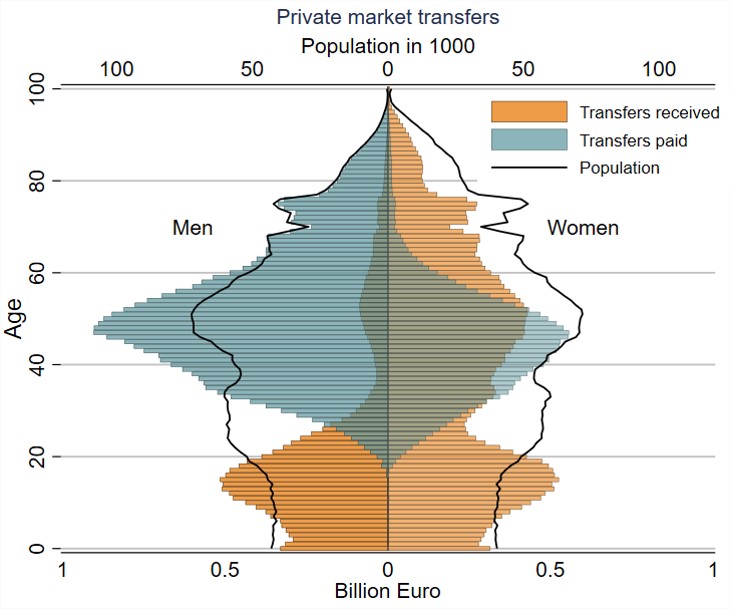
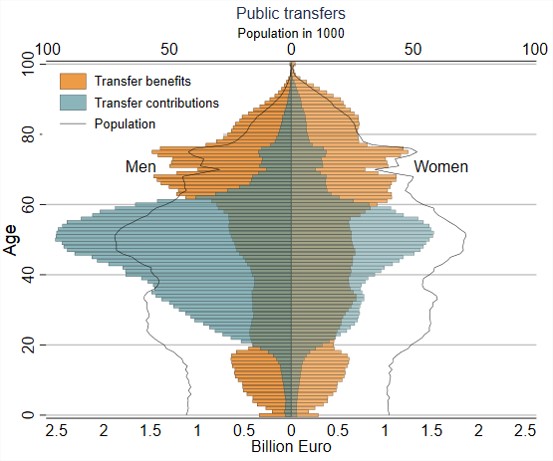
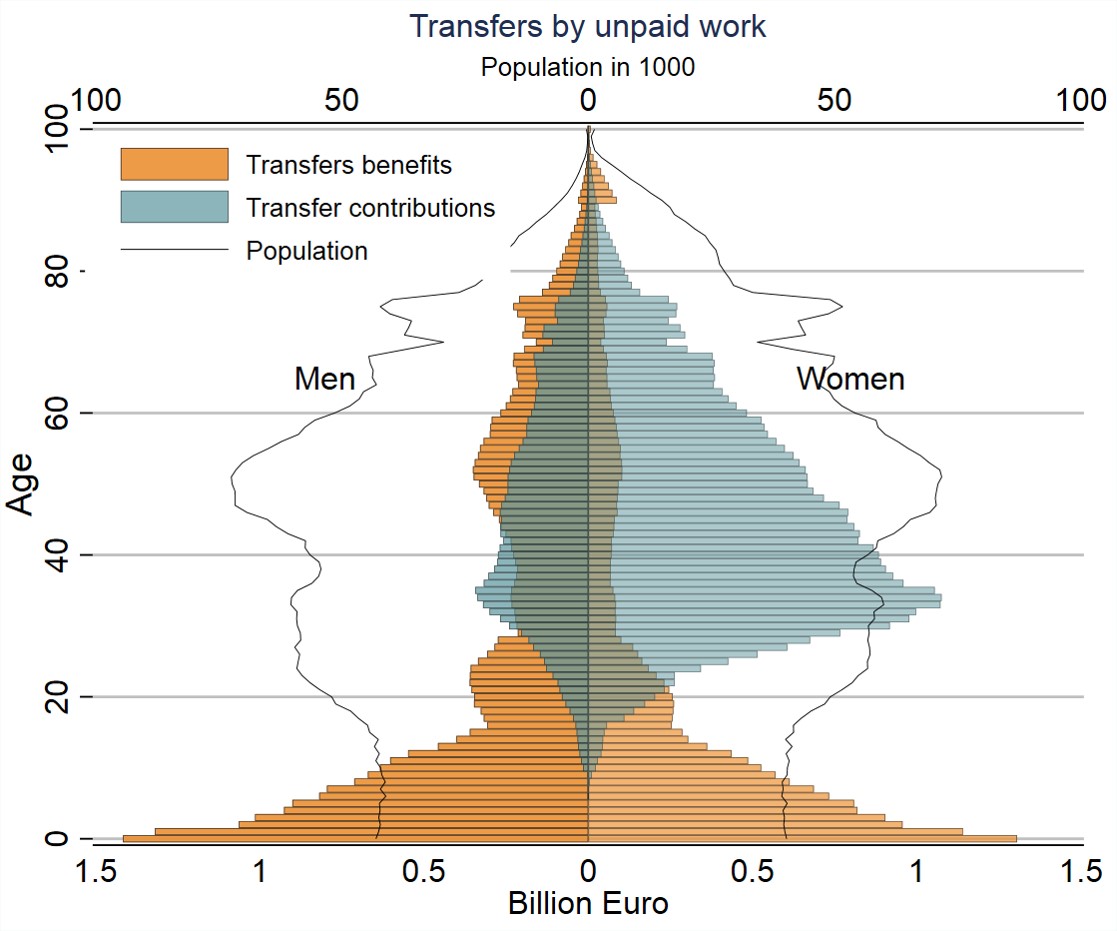
Income, consumption and transfers in Austria 2015
Presentation with dynamic population pyramid: NTA2020 Binder-Hammer
Abstract
At the heart of all NTA analysis are age-specific economic activities that are typically represented as simple line graphs. However, if results from many countries are displayed then researchers end up having spaghetti graphs (i.e. too many lines in one figure), or having too many separate panels in one figure. These visualizations do not make it possible to recognize the real age-specific differences among countries. Moreover, cross-country visualizations of conveying NTA results in general are not NTA’s strong side, even though results are available for more and more countries. In order to overcome these problems, we will present new solutions on how to visualize NTA age profiles. We will introduce heatmaps and heatmap-like colour solutions to visualize LCD/LCS and YL and other NTA age profiles as well as age profiles displayed along with age pyramids. These visualizations are much more insightful with regard to real cross-country age-specific differences. They also represent the important points of the age profiles well (for example when the age profiles turn negative/positive). By introducing these new visualization ideas, we would also invite others to start thinking with us about how we can better visualize and display NTA results to a wider public.
Very nice work! This reminds me of the Climate Change graphs showing temperature change by country over time. A nice summary plot. The same sort of heat maps could also be used to show demographic information (mean age by country/time, etc) for the NTA countries. I've also seen these kinds of climate change graphs presented as scarfs (knitted).