4.1 Private Transfers
Introduction
Private transfers are estimated after the researcher has estimated the economic lifecycle, public transfers, and public asset-based reallocations. The NT Flow Account includes current transfers, e.g., the transfer of current income across households or from households to non-profit institutions and the transfer of current income within households. Capital transfers such as bequests, dowry, and similar large transfers are not current transfers and are not included in the Flow Account.
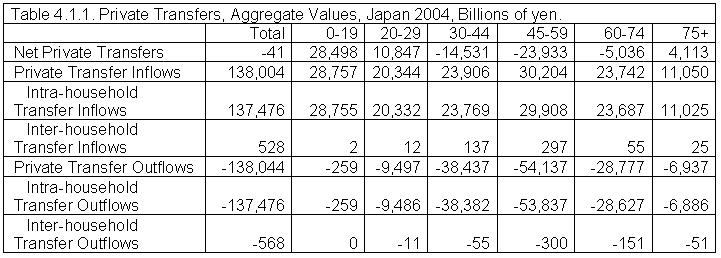
Table 4.1.1 illustrates the private transfer accounts using estimates for Japan 2004 (Ogawa et. al) with broad age groups. The total private transfer inflow was 138 trillion yen. The total private transfer outflow was slightly more, leaving 41 billion yen of net outflow, which must match total net transfer to ROW. While all age groups recorded substantial inflows, the outflows were concentrated on certain age groups. The transfer outflow was largest for the 30-44 and 45-59 groups. The outflow of these groups is 170% of their transfer inflow. In contrast, the outflow for 0-19 group is less than 1% of their inflow. The 75+ age group’s private transfer outflow is 63% of its private transfer inflow. Net private flows were from those in the 30-74 groups to those in the 0-29 and the 75+ age group. Another important feature of the private transfers is that the inter-household transfers are much smaller than the intra-household transfers.
Inter-household Transfers
Inter-household transfers consist of direct transfers between households, transfers mediated by NPISHs, and transfers to and from ROW. Inflows are current economic transfers received by resident households and ROW. Outflows are donations and gifts given to households, to NPISHs and to the ROW. Inter-household transfers are assigned to the household head.
Aggregate Controls
In principle UNSNA reports transfers between households and between households and other private institutions, but in practice NIPA estimates of inter-household transfers are not reliable. As a consequence, NTA values are based on survey estimates of private transfers received and given. More information about estimating transfer inflows and outflows from survey data is provided below. In general, inflow estimates will be inconsistent with outflows estimates. In a closed economy they would sum to zero, but in an open economy private inter-household transfer inflows plus net private transfers to ROW will equal inter-household private transfer outflows. Inflows and/or outflows must be adjusted to insure that consistency with estimates of net flows to ROW. Remittances are classified as either compensation, i.e., labor income, or as current transfers from ROW using the information from Balance of Payments (BOP). In the Philippines, for example, many workers abroad are guest workers, considered to be residents of the Philippines, and their remittances are classified as labor income. In contrast, Mexicans working in the United States are typically not guest workers and their remittances are classified as current transfers. Three methods for adjusting inflows and/or outflows are discussed in detail below. Country teams will have to decide which method is most appropriate for their case based on the team’s knowledge of data quality and whether the inflow or outflow side is suspected to be over- or under-estimated. In some countries specialized surveys which emphasize inter-generational transfers may provide more accurate estimates of aggregate inter-household transfers.
Adjustment Factor in Inter-Household Transfers
There are three possible ways to adjust for the inter-household transfer inflows and outflows:
1. If we let TF be the control total for net private transfers and TFBIagg the total aggregate inter-household inflows and TFBOagg the total aggregate inter-household outflows, the multiplicative adjustment factor for TFBO and TFBI is:
2. The following adjustment factors for inflows TFBIadj and for outflows TFBOadj can also be used if one adjustment factor, computed above, is not sufficient.
3. The last method is if adjustment is to be made to either inflow or outflow but not both, the multiplicative adjustment factors TFBOonly_adj or TFBIonly_adj are computed as follows:
The abovementioned computations may result in very different outcomes if the difference between TF and TFBIagg + TFBOagg is at all large. Country teams should be very careful in deciding which method makes the most sense for them and then should check the results to make sure they are reasonable.
Age Profiles of Private Transfers
The age profiles of private transfer inflows and outflows are estimated using a nationally representative income and expenditure survey. The age profile of transfer outflows is estimated using reported cash and in-kind gifts and donations. Examples include, but are not limited to,
- Congratulatory gifts
- Obituary money
- Farewell presents
- Regular/irregular donations
- Remittances
The age profile of transfer inflows is estimated using similar variables that capture cash and in-kind gifts received by the household. The exact variables will differ from country to country. Inter-household transfers are classified by the age of the household head in the receiving or the giving household. Each household must have only one person designated as the household head.
Intra-household Transfers
While inter-household transfers are estimated directly by survey data, intra-household transfers are estimated indirectly as the balancing item between private consumption and disposable income (labor income plus net private transfers plus public cash transfer inflows less taxes paid). Household members with a deficit (disposable income less than current private consumption) receive transfers from household members with a surplus (disposable income greater than current private consumption). If disposable income is insufficient to fund household consumption, the household head makes additional intra-household transfers out of asset income and if necessary by dis-saving. If disposable income is more than sufficient to fund household consumption, the residual is transferred to the household head and saved.
The consumption of durables, including the services from owner-occupied housing, are treated in a distinct fashion because, by assumption, the household head owns all household assets and all income generated by those assets flows to the head. The consumption of durables by any non-head household member is funded by an intra-household transfer from the head to the member equal to the value of member's durable consumption.
Net intra-household transfer estimates are only as accurate as the estimates from which they are constructed – private consumption and the components of disposable income. Moreover, assigning assets and asset income to the household head has important implications for the calculation of net transfers. Non-heads members with a deficit draw on the assets of the head, not their own assets, to support current needs. Non-head members with a surplus cannot save, but rather transfer their surplus to the head to be saved. The methods described here allow us to construct separate estimates of these flows which are useful for judging their potential importance.
The methods described here make additional assumptions to allow more detailed estimates than required for the construction of net inter-household transfers. First, intra-household transfer inflows and outflows are constructed by assuming that no individual within the household has both inflows and outflows with one exception: a household member may have current transfer outflows and a transfer inflow associated with the consumption of durable services. To the extent that household members actually have both current transfer inflows and outflows, the estimates produced by these methods will understate inflows and outflows, but not net inflows.
Second, we construct estimates of intra-household transfers by purpose, e.g. education, health, etc. To do so, we assume that the size of the sector-specific intra-household transfer inflow is proportional to sector-specific consumption by the individual receiving the transfer. Hence, in these calculations we do not incorporate the possibility that intra-household transfers are targeted at particular sectors.
Third, we construct estimates of joint age distribution of inter-household flows by assuming that the proportion of flows received from any age group depends only on the contribution of that age group to the total flow. In other words, there is no age targeting within the household. The estimates do not allow for a possibility that might occur within a three generation household: children depending more on siblings while co-resident elderly are receiving more of their support from their adult children.
Aggregate Controls
No aggregate controls are available for intra-household transfers. Intra-household transfers to and from ROW are by definition zero. Domestic net intra-household transfers must sum to zero. Total inflows and outflows are constructed from household survey data using methods described below.
Methodology
The methods for allocating intra-household transfers rely on the following procedures, which are explained in turn.
- Data preparation
- Transfers for current consumption
- Transfers of remaining surplus to household head
- Transfers for housing and other durable consumption
- Aggregate control for intra-household transfers
There are three data preparation considerations that come up in the intra-household transfer methodology. First, each household must have one and only one person designated as the household head. Second, consumption values must be non-negative. Negative consumption values can arise when model-based estimation is used. Third, all unsmoothed input variables, adjusted to match aggregate controls, should be available. The necessary input variables are age profiles of labor income, sector-specific current and durable consumption, public cash transfer inflows, and taxes paid including indirect taxes on consumption (or equivalently public transfer outflows and public asset income and saving).
The best case is that all these variables come from one survey, which is not always possible. However, if more than one survey is used to estimate input variables, two additional steps are needed before the methodology can be applied. First, select one survey to provide the household composition information (and other estimated inputs based on that survey). It must identify the household head and provide the age of all members of the household. Second, assign control total-adjusted profile values to each individual based on age. These profiles can come from whichever survey the country team thinks provides the most accurate data. Then apply the following intra-household transfer methodology using the assigned profile values instead of adjusted survey responses.
It should be noted, however, that the multi-survey method cannot be used to calculate profiles for any sub-types of households where the original profiles might be different by the sub-types. For example, if we wanted intra-household transfer profiles by education of household head, we could not just apply the overall average profiles to different households. There is probably an interaction between education and the shape of the original profiles that we would be missing, giving inaccurate results. A second limitation of this approach is that the inflow and outflow estimates, although not the net flows, will be substantially biased towards zero.
Computing transfer for current consumption proceeds in four steps. First, compute the current surplus or deficit for each household member, including the household head, and for the household. A household member has a current surplus if his or her disposable income is higher than current private consumption; otherwise a deficit. Disposable income is defined as labor income plus net private inter-household transfers plus public cash transfer inflows less taxes paid including taxes on products and production (indirect taxes). Current private consumption is private consumption less the services from owner-occupied housing and other consumer durables. The household surplus is equal to the sum of the individual surpluses; the household deficit is the sum of the individual deficits. A shortfall exists for household j if the total deficit exceeds the total surplus. If there is a shortfall, the household must fund the consumption of some members relying on asset-based reallocations.
Second, calculate a household specific “tax rate”. By assumption the tax rate on each individual’s surplus varies across households but is independent of the age of the individual within the household. A flat-rate tax for household j is calculated as . This flat-rate tax is imposed on each member’s surplus income and the taxed surplus is transferred to support current consumption of members with a deficit.
Third, calculate intra-household outflows for current consumption. The current intra-household transfer outflow for non-heads is equal to the tax rate times the surplus. For heads the outflow is the tax rate times the surplus plus any shortfall that the head must fund using asset-based reallocations.
Fourth, calculate the intra-household inflows and outflows for current consumption by purpose. The current intra-household transfer inflows to non-heads in each current consumption sector are proportional to that individual’s current consumption in that sector. For heads, the calculation is similar except that the head may have to finance his or her own deficit through dis-saving or asset sales, which would not be recorded as a transfer. For example, education transfer inflows for head is calculated by a formula, (education consumption / total current consumption) times max (0, deficit of head – shortfall of household). Current transfer outflows from individual i in each current consumption sector are proportional to the total household inflows to each sector.
Any surplus held by non-heads that is not taxed for current consumption transfers is transferred to the head to be saved. The head receives all surplus that is not transferred to other household members.
Transfers of the services from owner occupied housing and other durable goods are calculated separately. Both transfers are outflows from the head and inflow to non-heads. The inflows to non-heads are equal to the consumption by each non-head of services from durables; for non-heads no outflows arise from durables. The durable service outflow for the head is equal to the total consumption of durable services by non-head members, and the head receives no inflow.
Once the transfer variables have been constructed, a check on the calculations is that total intra-household transfer inflows must equal total outflows for each sector for each household and in aggregate. After all checks have been completed, tabulate by age to construct the age profiles. Smoothing should be accomplished in the same way that we smooth all other profiles. The file below shows a spreadsheet example of the transfer methodology described above for one household with current consumption sectors, education, health and other current consumption, housing, and other durable consumption.
Stata programming code for the case of Taiwan is available in the Appendix section. The intra-household methodology results in net aggregate intra-household transfers of zero, both overall and by each type of transfer. Everything balances in the survey population – total inflows equal total outflows for each type of flow and for all flows combined. However, the total population will often have a slightly different age distribution than the survey population. If this is the case, in applying the total population to transfer profiles, the aggregate inflow/outflow balance is lost. The difference should not be large if the survey is nationally representative. We need inflows and outflows to balance for each individual and to balance for the entire population. While there are several ways to solve this problem, the best answer is to adjust only the outflows to match the inflows. That is, the multiplicative adjustment factor on outflows is the ratio of aggregate inflow to the aggregate outflow, times negative one. This way our accounting identities are preserved and all flows balance. The downside is that the adjustment comes out of private saving because that is estimated as a residual. As mentioned previously, though, this adjustment should be very small. Note that we must adjust the lowest-level profiles first, and then sum those adjusted profiles to higher-level profiles.
If the difference does turn out to be very large, there may be a problem with the implementation of the methodology or the survey. If the adjustment factors are larger than 1-2%, check whether you are implementing the methodology correctly and whether your survey population is a good representation of the national population.
Mathematical Presentation for Intra-household Transfers
1. Intra-household Transfer Outflows
a. Preparation of Data
b. Current surplus or deficit for each member (i) and for the household (j)
c. Calculate the tax rate
d. Intra-household transfer outflow
2. Inflows and Outflows by sector
a. Sector Inflows
b. Sector Outflows

where: xxx = can be Education or Health or Other Consumption
3. Saving a. Any surplus held by non-heads that is not taxed for current consumption transfers is transferred to the head to be saved:
b. The head receives all of this excess surplus as an inflow:
4. Transfers for Durable Consumption
where: xxx = Housing or Other Durable Consumption
5. Construction of Age Profiles of Total Intra-household Inflows and Outflows
Illustrations
The illustrative values presented here should not be taken as a standard or model to which other countries conform. Values may vary widely from country to country. These estimates were constructed by the research team at Nihon University Population Research Institute (Ogawa et al. 2008).
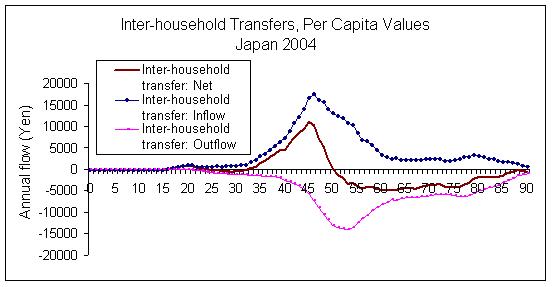
Inter-household transfers are gifts and donations received and given either directly to another household or to a NPISH. Note that inter-household transfers are modest in Japan – the peak inflow is about 15,000 yen or roughly US$150. Most inter-household transfers are to and from prime age adults while net flows to older adults are relatively modest. Inter-household inflows may indirectly benefit the young and old to the extent that they are received by household heads who, in turn, provide support to dependent family members.
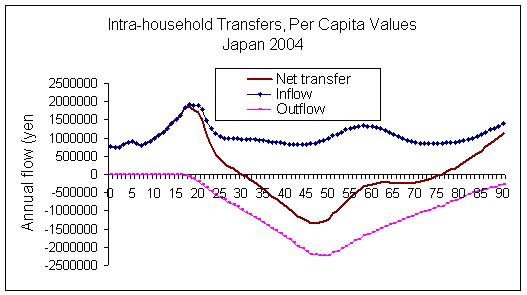
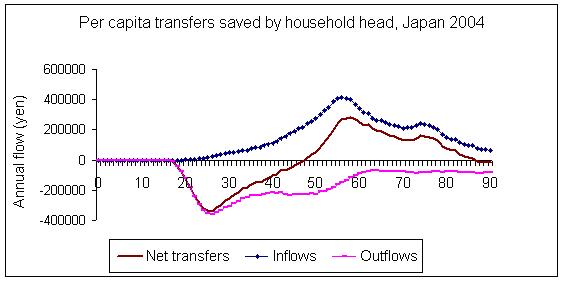
The following figure presents per capita intra-household transfers in Japan. Inflows peak at around age 20, when the costs of children are high, and again to those in their late 50s. The inflow also increases with age for those for 80 and older. Outflows rise from the late teens, peak in the late 40s, and then decline gradually. Net intra-household transfers are positive approximately for those below age 30 and those above age 75. They are negative for those between 30 and 75, approximately. An interesting feature of Japan is that the net intra-household transfers are negative for those in their late sixties and early 70s. Perhaps they are supporting both their adult children and their parents, but determining this based on the results presented in this graph is not possible.
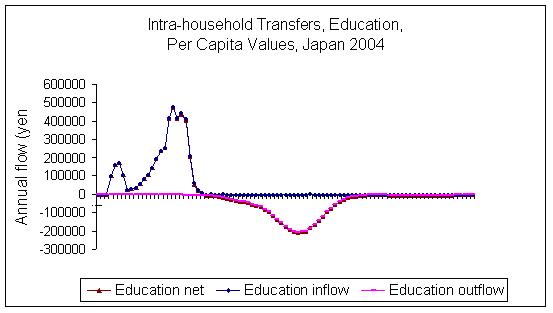
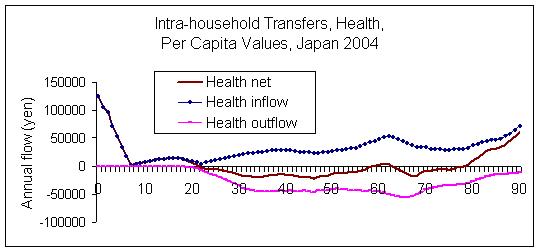
The next two figures report intra-household transfers for consumption of education and health, respectively. Intra-household transfer inflow for education is quite similar to education consumption profile because in Japan those attending school do not rely to any significant degree on their own labor income or students loans to fund their education. Rather their schooling is funded almost entirely by transfers from family members. The peak in education transfer outflows occur at about age 50, which is essentially one-generation length above the age of the peak inflow. Few of the outflows are from those over the age of 60. The pattern is consistent with education transfers flowing primarily from parents to children. There is little evidence of education transfers from grandparents.
Health spending in Japan has a strong age gradient, as elsewhere, with consumption high among the very young and the very old. Japan has an expansive public health care system, although private spending is far from negligible. The most significant net inflows are to the young and to the very old.
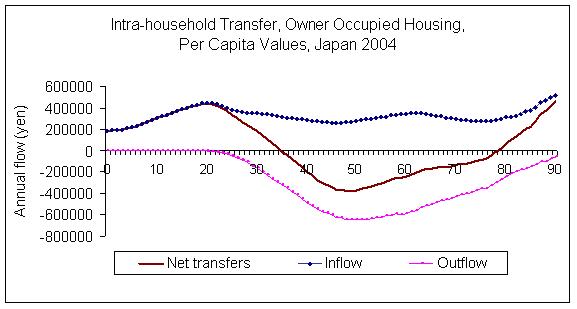
Transfers for owner occupied housing are shown in the next two figures. The inflows to non-heads are equal to the consumption of each non-head in that sector. The inflows for housing are not concentrated on any particular age group, but flow to all ages. Young children have somewhat lower inflows reflecting their lower consumption of housing. The outflow reflects age variation in ownership of owner-occupied housing as reflected in the age of the household head. Thus, outflows begin to rise in the early 20s, peak at around age 50, and then decline. The net flows are positive for those in their mid-thirties and younger and those 80 and older. Otherwise, the net flows are negative.
A complex and important objective is to understand the connections within the household between transfers and asset-based reallocations. These arise in several ways. First, asset income and dis-saving are identified with the age group of a particular individual (or age group). However, asset-based reallocations arise when the household consumption exceeds labor income plus net public and private cash transfers. Thus, households rely on asset income or dis-saving to fund their consumption because one or more of their members have large lifecycle deficits. In a similar vein, household saving occurs when the sum of labor income, asset income, and net public and private cash transfers exceeds private consumption. In some households, all of the saving may be a consequence of the surplus of the household head, but in some households non-head household members have labor income more than sufficient to cover their own needs and that of dependent household members. The value of this surplus is counted as a transfer from the household member in question to the household head. The outflows and inflows of these transfers sheds light on the relationship between individual measures of income and consumption and household measures of saving.
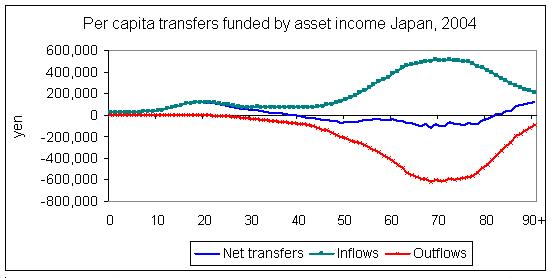
Per capita transfers funded by asset income are shown in the figure below. Both the inflows and outflows are concentrated among those in their sixties, seventies, and eighties in Japan. These are predominantly intragenerational transfers between the head and the spouse. Children and the very old, i.e., those in their mid-eighties and older, are net recipients of transfers funded by asset income. The net values are small relative to the gross flows, but they are far from negligible. Those in their late teens and early twenties have net transfer in excess of yen 100,000 ($US 1000), for example.
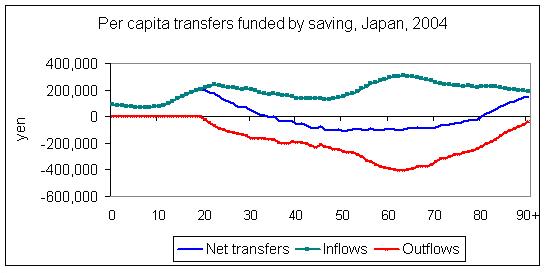
Per capita transfers funded by saving are similar in some respects to per capita transfers funded by asset income. The largest inflows and outflows occur in the late 50, 60s and early 70s. Again, many of these transfers are intra-generational, from heads to spouses. The net transfers identify more clearly the inter-generational flows and these are similar to those funded by asset income. Children, young adults, and those in their eights are net recipients of transfers funded by dis-saving on the part of those between the ages of 35 and 80.
The final figure in this section presents the age profiles of saving transfers, i.e., the intra-household transfer surplus. Any surplus held by non-heads that is not devoted to current consumption transfers is transferred to the household head and saved. In Japan, the surpluses of those in their 20s and 30s are substantial as are the inflows of those in their 50s and older.
-- Go to next page 4.2 Private Asset-Based Reallocations
-- Back to Table of Contents