NTA Visualization Challenge
Saly, SENEGAL -- Winners of the first ever NTA visualization challenge were announced at the closing of the 11th Global Meeting of the NTA Network held on June 20-24, 2016 at King Fahd Hotel, Dakar and Lamantin Beach Hotel, Saly in Senegal. Participants uploaded their entries to the NTA website. An independent panel of judges chose the winners in the challenge.
- First Place: Financing consumption over the lifecycle by Michael Abrigo
- Second Place: NTA Flows using Sankey Charts by Ricardo Cantú
- Third Place: Austria Lifecycle by Bernhard Hammer
- Honorable Mention: The Impact of an Aging Population on the Economy: Introducing the NTA Support Ratios by Lili Vargha and Robert Gal
- Honorable Mention: Animated Population Pyramids in Stata by Morne Oosthuizen
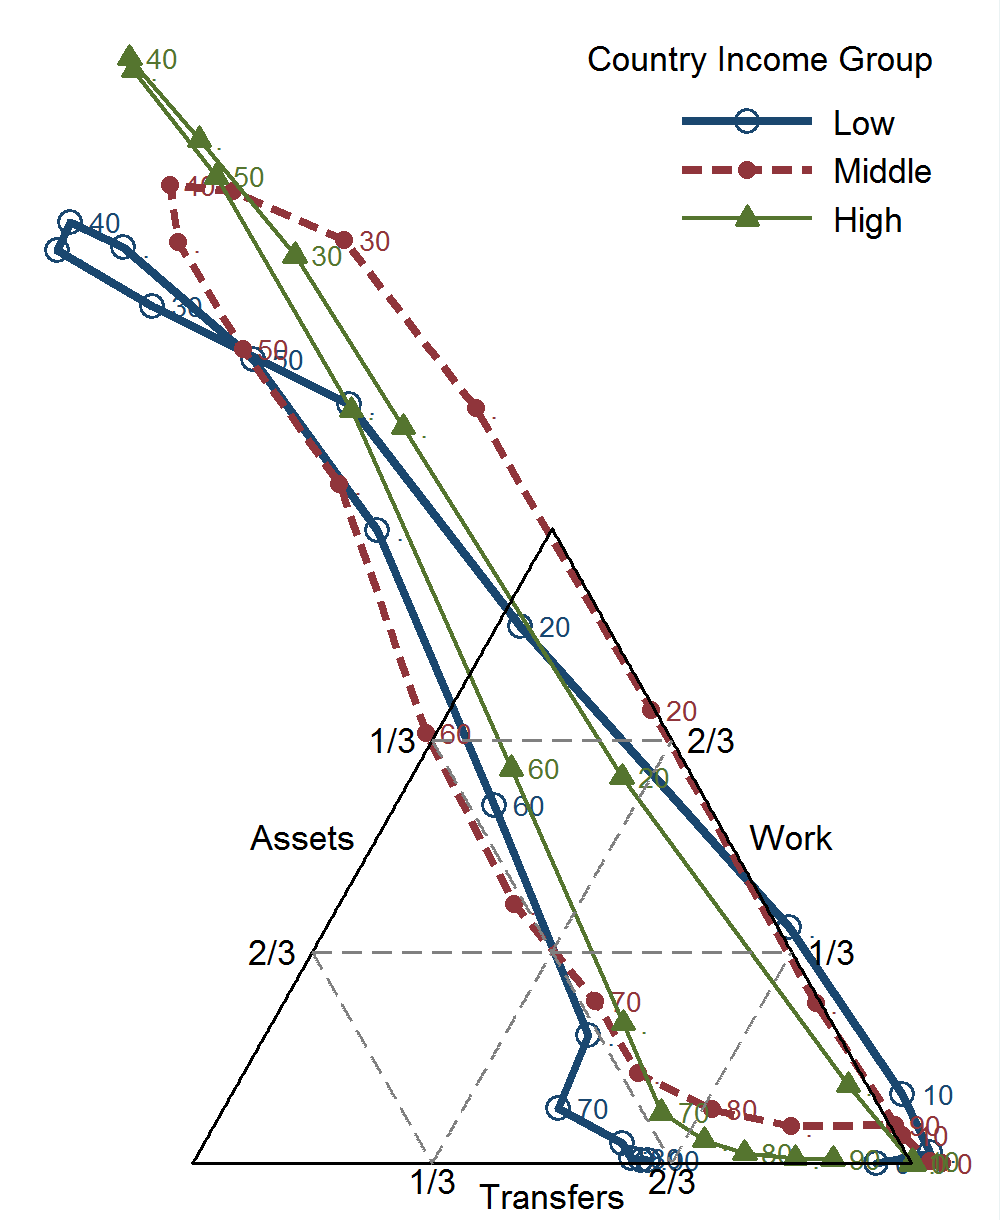
First Place: Financing consumption over the lifecycle by Michael Abrigo
Michael Abrigo (Philippines) animates how consumption is financed at different stages of the lifecycle. He provides separate estimates for countries at different stages of economic development.
Download static version
Second Place: NTA Flows using Sankey Charts by Ricardo Cantú
Ricardo Cantú (Mexico) illustrates the flow of the economic resources from their production down to their final use, from a generational perspective. On the left side, resources are produced and identified by ages. At the center, they are transferred between generations. Finally, on the right side, resources are consumed in health, education, savings, and others, again identified by ages. It is an interactive chart where you can select two different countries to compare their similarities and differences.
Children: age 0 to 24.
Adults: age 25 to 64.
Elderly: age 65 and more.
Files: Sankey Stata, Sankey HTML
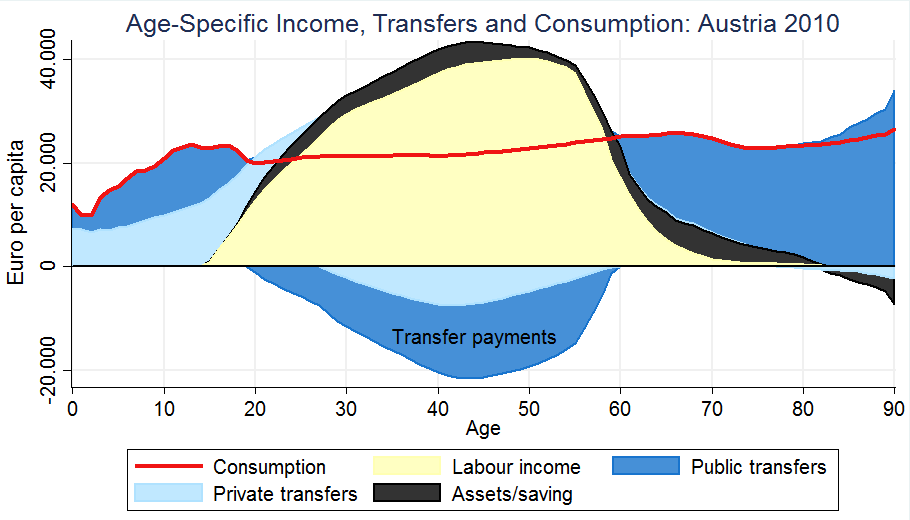
Third Place: Austria Lifecycle by Bernhard Hammer
Bernhard Hammer (Austria) presents Austria's most important graph, i.e. labor income and consumption age profiles, overlayed with the age profiles of components of age-based reallocations. The visualization provides a great summary of the entire NTA flow account.
Honorable Mention: The Impact of an Aging Population on the Economy: Introducing the NTA Support Ratios by Lili Vargha and Robert Gal
Lili Vargha and Robert Gal (Hungary) summarize key insights on changing age structures in Hungary using NTA results. In this visualization, they likewise present various NTA-based indicators.
Honorable Mention: Animated Population Pyramids in Stata by Morne Oosthuizen
In this visualization, Morne Oosthuizen (South Africa) showcases using Stata to create animated .gif's. He presents South Africa's population age pyramid for 1950 to 2050. Base data are from the UN's 2015 World Population Prospects.