3.1 Public Transfers
Introduction
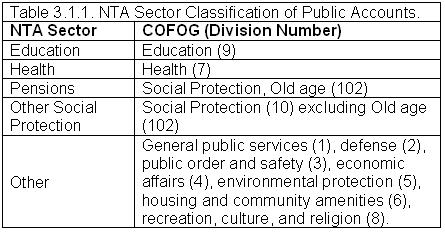
Public transfers in NTA are classified by function following the UN Classification of Functions of Government (COFOG). NTA uses a simpler, but consistent, classification that emphasizes functions with large inter-age flows (Table 3.1.1).
Public transfers for education, health, and pensions are estimated for all countries, although some countries do not have public pension programs. In some cases, other programs may be important. For example, unemployment benefits may accrue more frequently to young workers. The particular programs for which estimates are constructed will vary with the particular public programs and policies of the country in question.
Transfer Inflows
Public transfer inflows can be usefully summarized as in Table 3.1.2. In most instances there is no ambiguity as to whether inflows should be classified as in-kind or as cash. In general, in-kind public transfers inflows are goods and services received directly from government agencies as opposed to goods and services that are purchased with the benefit of a publicly provided cash subsidy. Hence, public schooling is an in-kind transfer whereas a scholarship is a cash transfer. An exception to this approach is health. National health insurance payments and similar reimbursement programs, e.g., Medicare and Medicaid in the US, are classified as in-kind transfer inflows (and as public consumption). This approach is intended to facilitate comparisons across countries, but also because the provision of health care and health care prices are so widely regulated. Note that in-kind public transfers and public consumption as calculated in NTA are equivalent. The Rest of the World receives some public transfer inflows, e.g., public pension payments to individuals who are foreign residents.
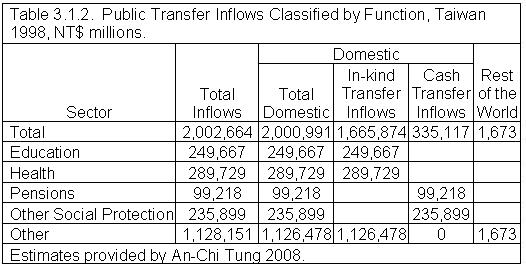
The principle followed for estimating the age profile of inflows is that the inflow is assigned to the age groups of the intended beneficiaries of the public program. The value of school lunch programs, for example, is assigned to students. Pre-natal health care is assigned to the mother. Some cases are difficult to assign, e.g., maternity benefits could be assigned to the mother, the newborn child, or split. In the case of a US transfer program called TANF, you only qualify if you have children but the amount you receive is based on family size including any adults. In this case benefits are being equally assigned to all household members, but alternatives could be considered. Many public transfers do not accrue to individuals at all. These inflows are assumed to be divided equally among all members of the population.
Methods for constructing age profiles of public consumption and, hence, in-kind public transfer inflows are discussed in detail in the section on the economic lifecycle and are not repeated here. Cash transfers are estimated using administrative records or household surveys with information about the amount of public cash transfers and characteristics of the recipients. Some public transfer inflows accrue to the Rest of the World. For example, public pension benefits may be paid to former residents who have emigrated.
An issue that sometimes arises is the treatment of payments to public employment retirees from employment-based pensions programs. These payments are not public transfers. They are essentially deferred compensation and discussed above in the Economic Lifecycle section on labor income.
Transfer Outflows
Transfer outflows must equal current transfer inflows and, hence, their total value for each function is determined by the methods described in the preceding section. Public Transfer Outflows are equal by definition to Public Transfer Inflows and also equal to Taxes and Grants plus the Transfer Surplus(+)/Deficit(-). In the transfer deficit case, taxes and grants are less than public transfer outflows. Additional outflows can be generated in two ways through asset-based reallocations. One possibility is that public asset income is positive generating an inflow to taxpayers, captured in asset-based reallocations. Of course, public income is not distributed to taxpayers. To the extent that it is used to finance public transfer programs the asset income inflow is balanced by a transfer outflow. In essence, the asset income is taxed to finance public transfers. If public asset income is insufficient to offset the transfer outflow deficit, transfer programs must be financed partly through the acquisition of public debt. Public borrowing creates an inflow to taxpayers, an asset-based transaction, and a public transfer outflow as the funds are used to finance public transfer programs.
In the surplus case, taxes and grants exceed public transfer outflows. The surplus is saved as well as public asset income.
The important issue to be addressed is the age profile of the transfer outflow. To estimate the age profile we first identify the outflow source(s) for each public sector (function) and, second, estimate the age profile of each type of outflow source. This information is then used to estimate the age profile of public transfer outflows for each public transfer sector.
Transfer Outflows Sources
Transfer outflows in NTA are classified based on the economic resource, transaction, or activity being taxed. The categories are very similar to those used in Generational Accounts, but are different from those used in the UNSNA 1993 or the IMF GFSM 2001. Constructing NTA requires that taxes and grants be reclassified using the NTA system.
Eight transfer outflow sources (tax sources) are distinguished in NTA: - Labor income - Asset income - Consumption - Asset holding - Asset transactions - Other - Transfer deficit - Rest of the world
In this classification, taxes and social contributions are not distinguished. The principle that is applied in classifying taxes in NTA (and GA) is that second order and general equilibrium effects are not considered. Taxes are classified depending on the party assessed. Taxes on wages and earnings are paid out of labor income, taxes on profits out of profits, taxes on consumption out of consumption, etc.
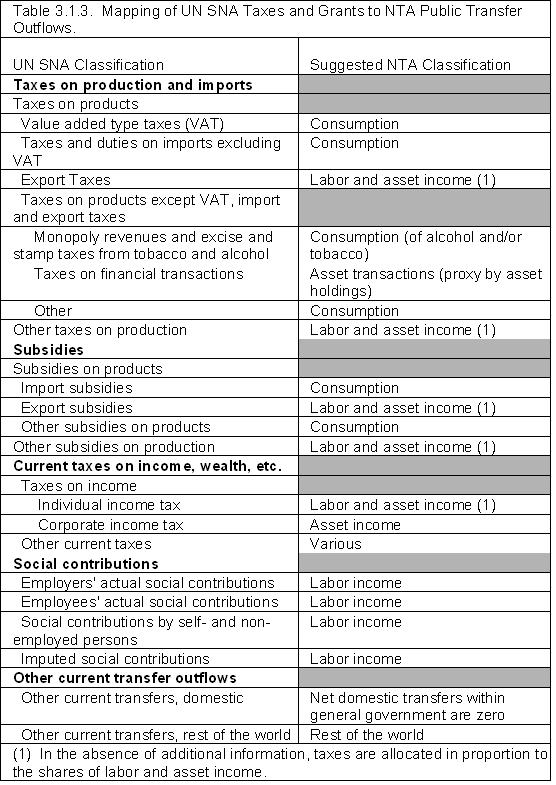
Suggestions for mapping from the UN SNA to the NTA classifications are provided in Table 3.1.3. Mapping from GFS to NTA is discussed in section 3.3 Using Government Financial Statistics to Construct NTA. Note that in many cases the mapping will differ from the suggested categories depending on the details of the tax system in question.
Estimating the age profiles of some public transfer outflows may require additional detail about some categories. For example, the age profile for taxes on tobacco and alcohol will differ from the age profile of taxes on general consumption.
For more detailed information about the taxes on production and imports and subsidies see UN SNA 1993 VII.C and VII.D (pp 169-174) and for current taxes and social contributions see UN SNA 1993 VIII (pp. 191-202).
Public Transfer Outflows by Function
In the simplest case, all public revenues are pooled into a general fund used to support all public programs. In this case, the relative age profiles of public transfer outflows will be the same for all functions, but they will vary in their magnitude. In many cases, however, the funding sources vary across public programs. This may occur because programs have earmarked or committed sources of funding. Pension programs are often funded through payroll taxes. Grants from foreign governments may target health or education programs.
A second reason that the source of outflows may vary by function is that different levels of government, each with their own taxing authority, may be responsible for different government programs. Education may be funded at the local level from property taxes while national defense is funded at the central level out of VAT, for example. A third reason is that some public programs may be run in a quasi-autonomous manner in the sense that deficits and surpluses do not become part of the government’s general fund.
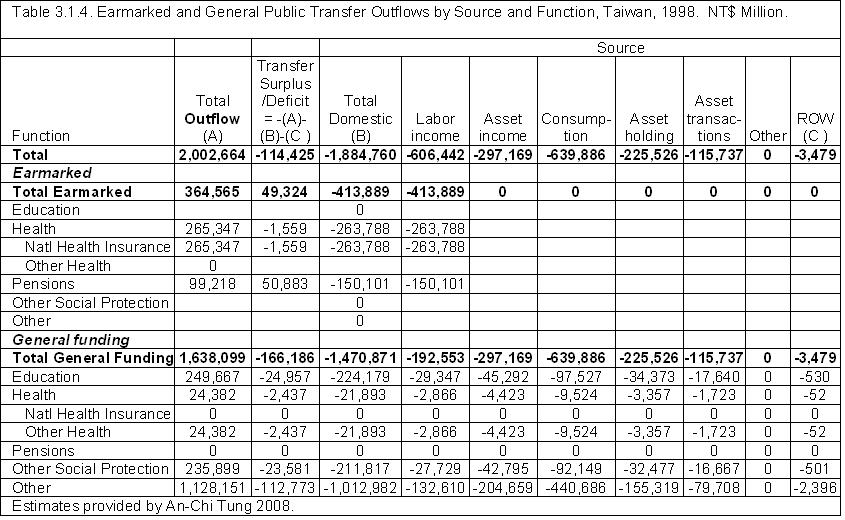
The procedure for handling earmarks is straightforward (Table 3.1.4). First, the source of funding for earmarks is identified. The inflow for independent programs is entered. Otherwise, inflows are set to the total of earmark outflows. Second, public transfer outflows from general funds by source are calculated as the difference between public transfer outflows and public transfer outflows by source. General fund outflows are distributed using the distribution by source for all general funding sources.
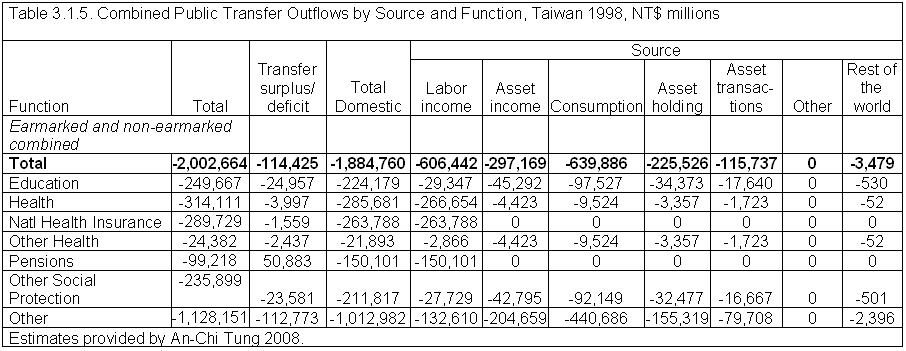
The transfer surplus/deficit is calculated separately for each function distinguishing earmarked and general fund support. The transfer deficit is assumed to have the same funding source distribution as the funded portion of each function. The logic behind this is that the alternative to the deficit is an increase in taxes. The counterfactual employed here is that had taxes been increased to cover the deficit, the existing function-specific tax structure would have persisted (Table 3.1.5).
In a federal system central, state, and local governments have independent authority to tax and spend. In this case public transfer outflows by source and purpose are calculated separately for each level of government. Likewise, if there are quasi-autonomous programs, e.g., public pension programs or national health insurance programs, public transfer outflows by source and purpose should be calculated separately for each of these programs. Note that this is accomplished in Table 3.1.5 by including National Health Insurance and Pensions as programs with earmarked funding sources.
Tax Incidence and Age Profiles of Public Transfer Outflows
The age profile of any public transfer outflows depends on the tax incidence – the age of the individual who bears the tax (Table 3.1.3). The profile of the public transfer outflow will depend on the age distribution of the economic resource being taxed and the age-profile of the tax rate. Some of the economic resources being taxed are components of NTA and, hence, their age profiles are available. The age profiles of earnings, asset income, and consumption are examples. Additional analysis will be required in other cases. For example, consumption of alcohol and tobacco are often taxed at a higher rate than other goods and they have a distinctive age profile. Note that some surveys have direct information on the amount of different types of taxes paid, so knowing tax rates and ownership is unnecessary.
Some tax rates do not vary by age. For example, sales tax rates and VAT rates do not depend on characteristics of the consumer. Taxes paid by each age group depend only on how much they consume of each type of good and service. Other tax rates vary by age for a variety of reasons: explicit provisions that favor age groups, e.g., exemptions for older individuals; ceilings on the value of the resource subject to taxation; taxes imposed only on resources above a floor; the use of graduated tax schedules; etc. Two general approaches can be used to estimate age-specific variation in tax rates. Administrative records may provide information about the age of those who paid taxes. Or household surveys may contain information about tax payments by households. If so, methods for allocating household variables to individual members may be used to estimate age-specific taxes and tax rates. Tax payments by employers on behalf of employees may be proportional to tax payments by employees. If tax rates vary by income level, one approach is to estimate separate age profiles of income for different income classes, apply appropriate tax rates to each income class, and aggregate up to a combined income tax schedule. This method has been employed in some Latin American countries.
In some instances direct information about the age profile of the resource may not be available. In this case it may be necessary to use a proxy. For example, the asset profile may serve as a reasonable proxy for asset transactions.
-- Go to next page 3.2 Public Asset-Based Reallocations
-- Back to Table of Contents